Baseline farm versus Elevarm-operated.
Potato, per hectare, per cycle. The uplift comes from three places at once: more tonnes, a better grade mix, and a lower input bill.
Across the 2025 pilot cohorts. The unit-economics table is a single conservative case — potato, one cycle — which is why its figures are smaller.
| Metric | Baseline farm | Elevarm-operated | Change |
|---|---|---|---|
| Yield (t/ha) | 18 | 22 | +22% |
| Grade-A share | 50–60% | 60–70% | +10pp |
| Average price (US$/t) | 493 | 583 | +18.3% |
| Gross revenue / ha (US$) | 8,874 | 12,826 | +44.5% |
| COGS / ha — inputs & labour (US$) | 3,690 | 3,180 | −13.8% |
| Shrink & rejects | 15–25% | 10–20% | −5pp |
| Contribution / ha — CM1 (US$) | 5,184 | 9,646 | +86.1% |
| Logistics & handling (US$) | 200 | 245 | higher volume |
| CM2 / ha (US$) | 4,984 | 9,401 | +88.6% |
| Payback (months) | 12–15 | 9–11 | −3 to −4 |
Payback based on capital investment in irrigation systems; other investment extends the period.
Double U Farm, Puncak
- Location
- Puncak, Bogor, West Java
- Farm size
- 14 hectares
- Commodities
- Chili, cabbage, long bean, durian
- Model
- Elevarm-operated (FMS)
A different commodity mix from the table above, and measured against a different baseline: this farm’s own prior seasons, not the modelled potato figures. The first cycle carries higher set-up cost; contribution margin still lands more than 25% above where the farm was, driven by yield.
+25% vs. this farm’s own CM
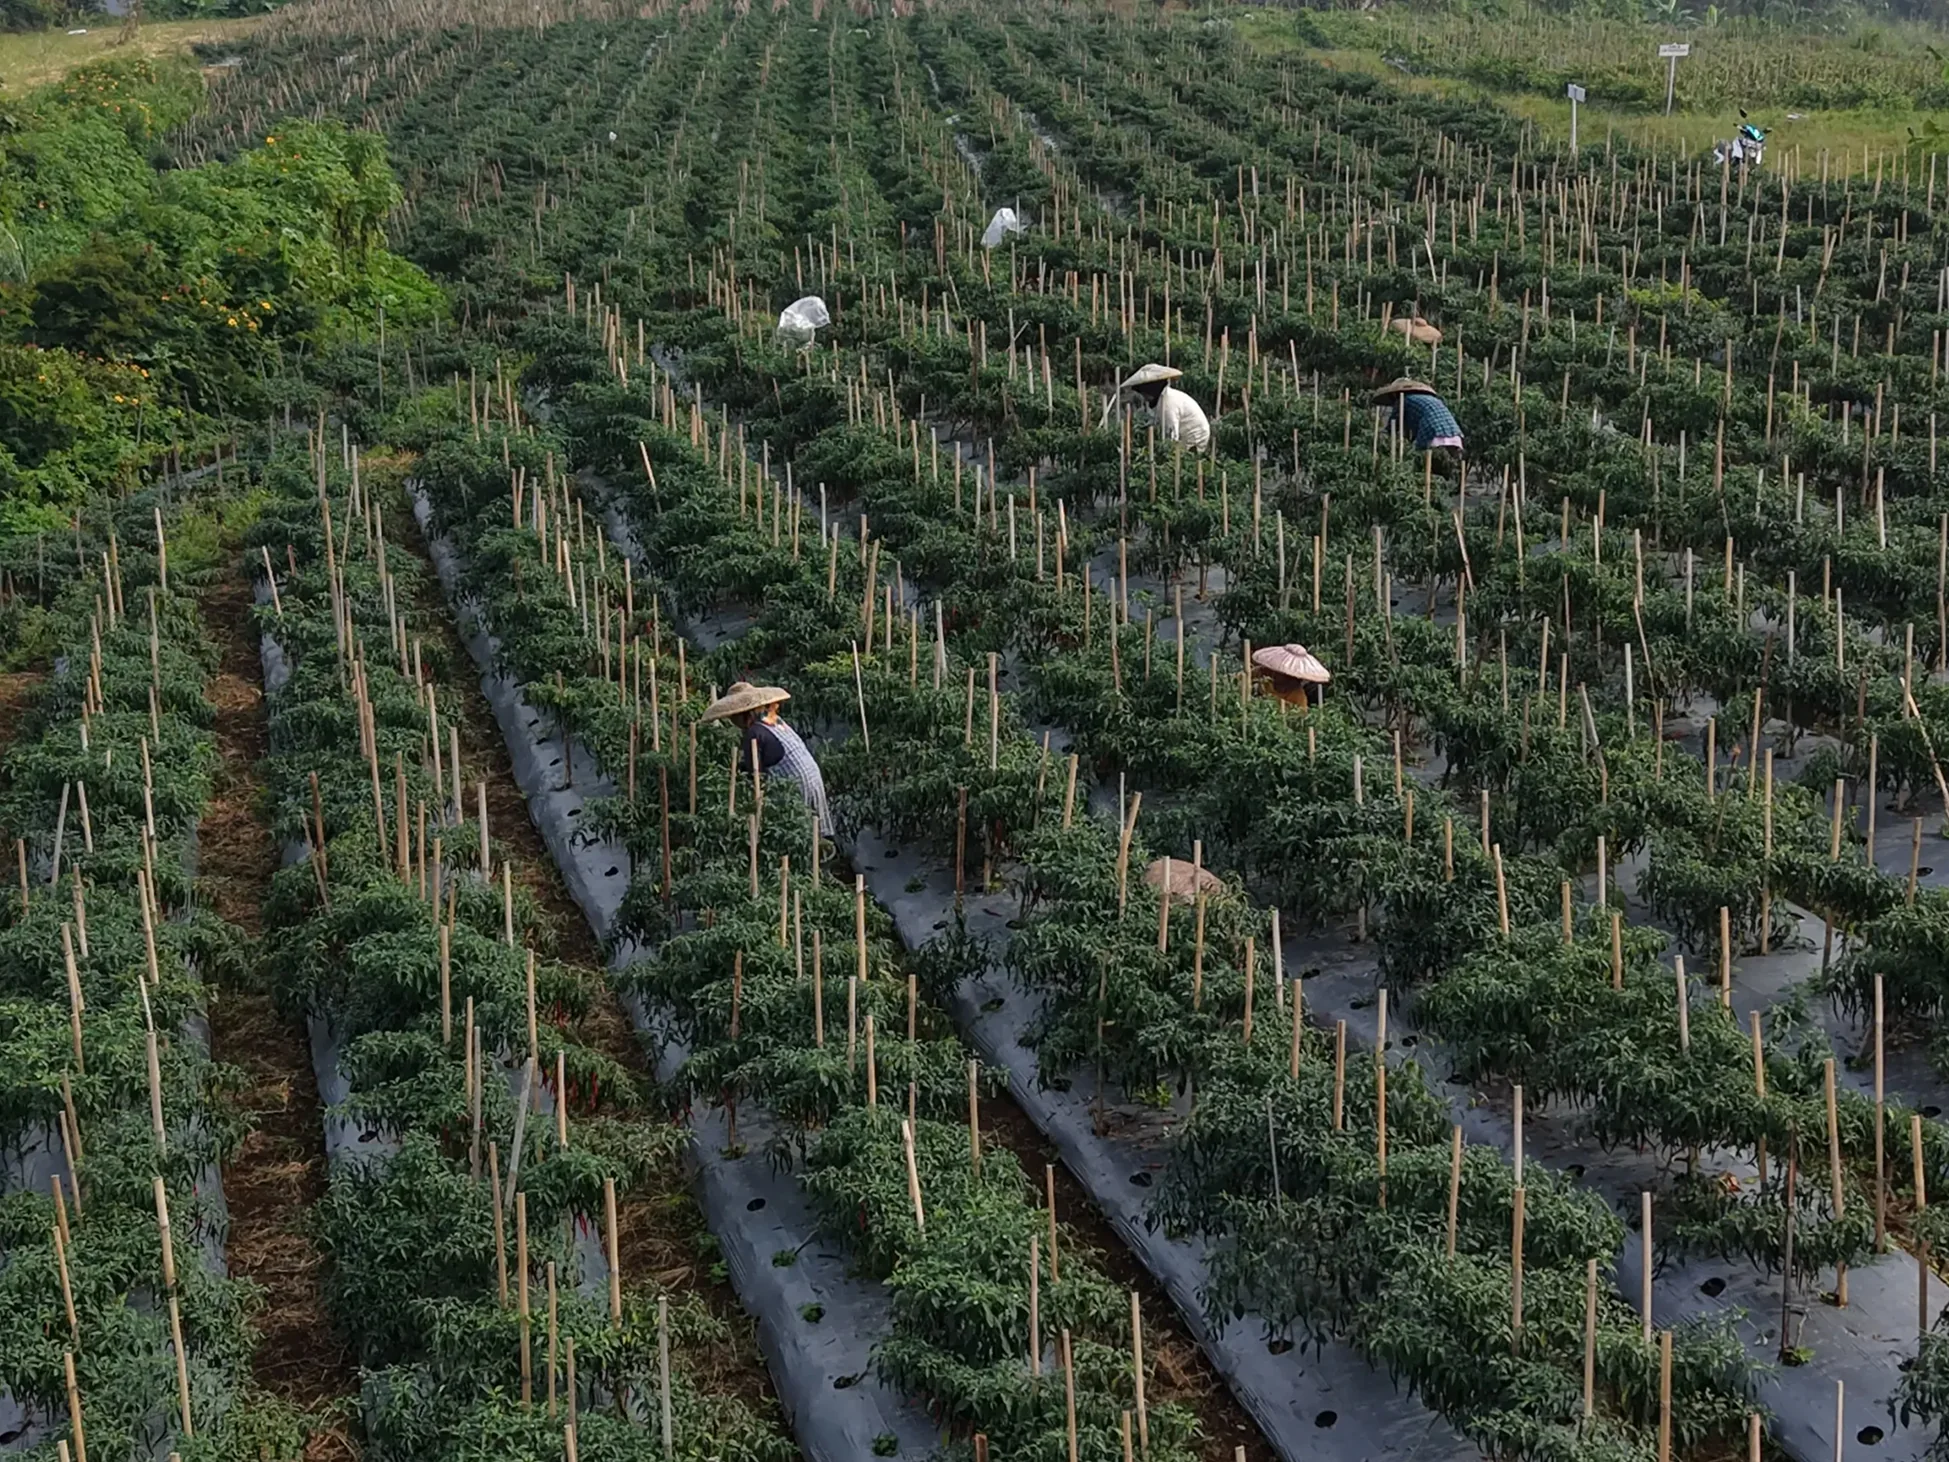
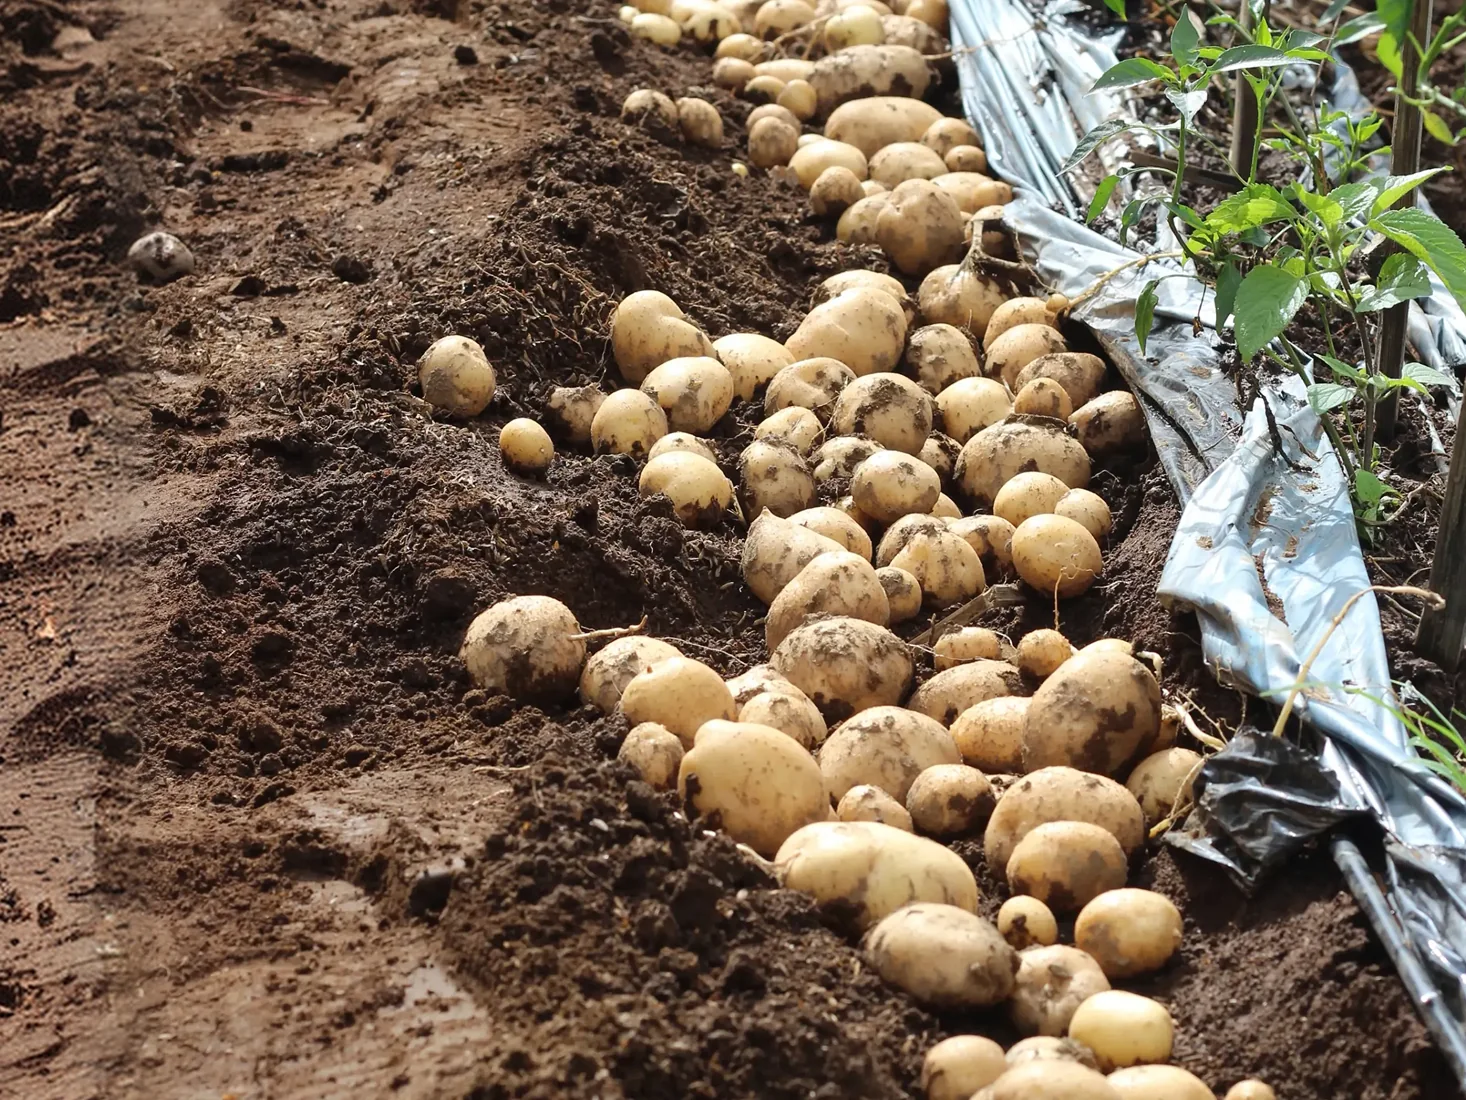
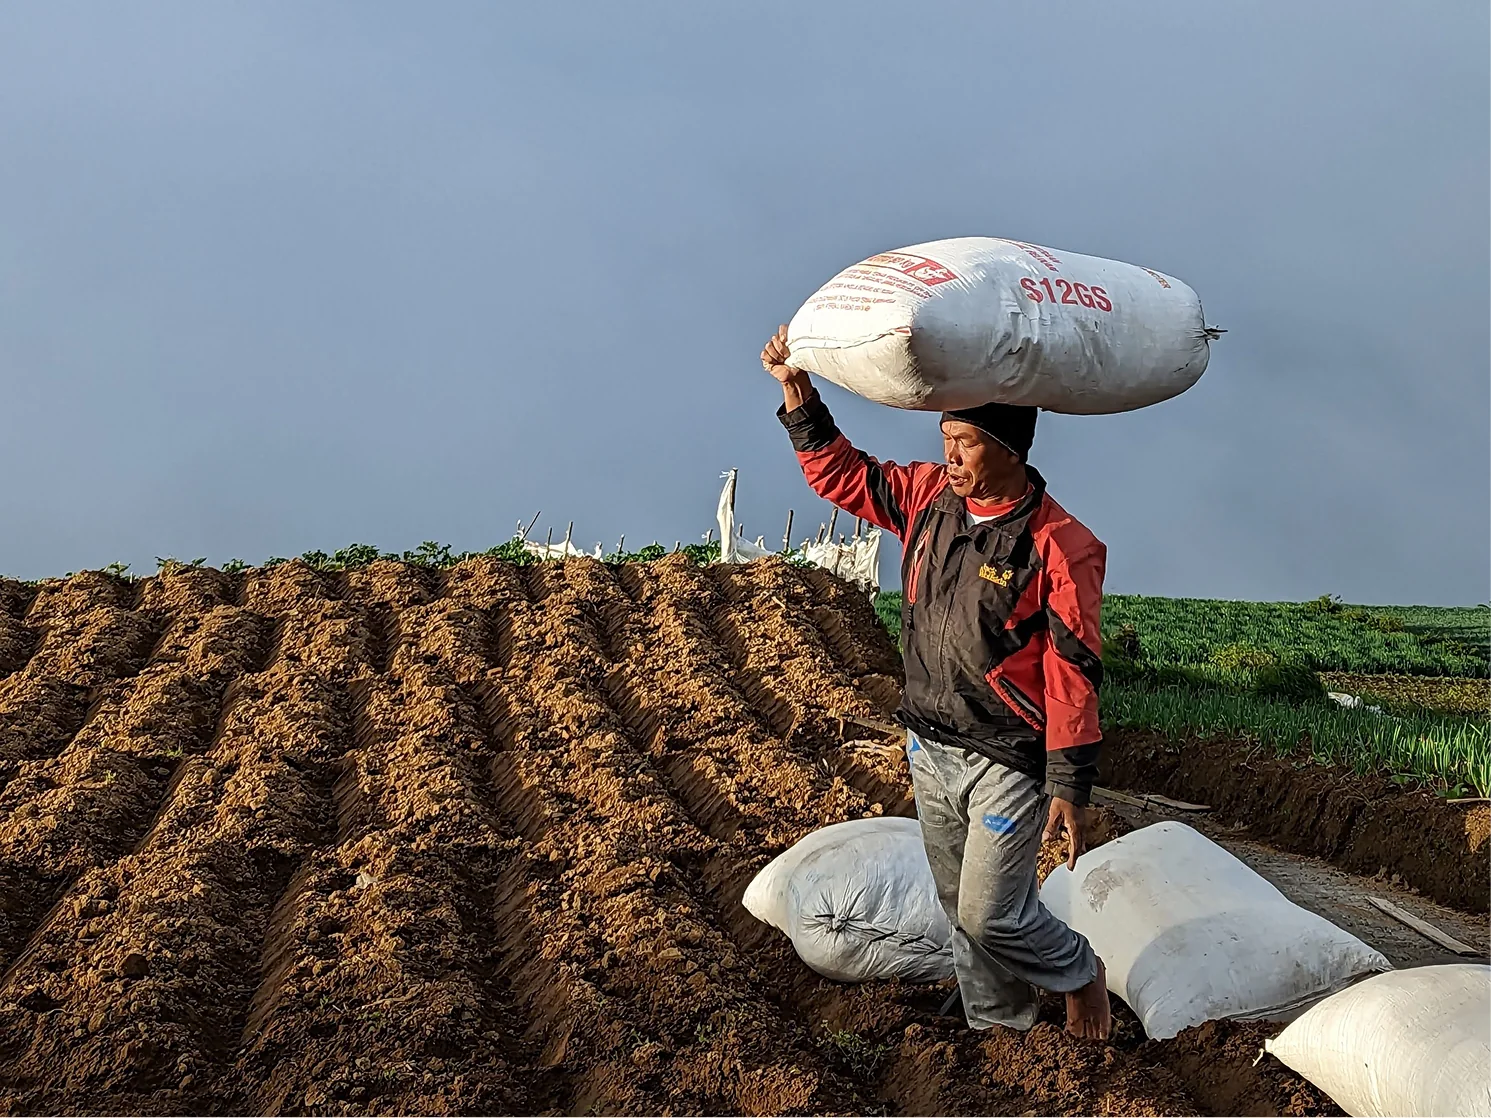
Captions carry the lot ID, so a photograph resolves back to the same block shown in VarmOS. Every frame is Elevarm's own operations photography — no stock imagery.
We are paid when the yield goes up.
Profit share or a KPI-linked fee — not a flat invoice that runs whether the harvest lands or not. If the numbers do not move, that is our problem too.